本檔案是由Maksim從en.wikipedia轉移到維基共享資源。
原始描述頁面位於
這裡。下列使用者名稱均來自en.wikipedia。
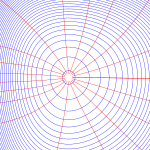
Done with Matlab.
| Public domainPublic domainfalsefalse
|

|
我,本作品著作权人,释出本作品至公有领域。这适用于全世界。
在一些国家这可能不合法;如果是这样的话,那么:
我无条件地授予任何人以任何目的使用本作品的权利,除非这些条件是法律规定所必需的。
|
.
Source code:
Lx1=-1.7; Lx2=2.3; Ly1=-2; Ly2=2;  % box dimensions
N=60; % split the box into N x N grid
[X, Y]=meshgrid(Lx1:1/N:Lx2, Ly1:1/N:Ly2); % the grid

f=inline('-((y+1).^4/25+(x-1).^4/10+x.^2+y.^2-1)');   % draw the level sets of f
fx=inline('-2/5*(x-1).^3-2*x'); fy=inline('-4/25*(y+1).^3-2*y'); % partial deriv
Z=f(X, Y); % the function value

figure(1); clf; hold on; axis equal; axis off; % pop up a figure
h=0.5; % spacing between heights
v=[-20:h:0.8 0.85]; % the heights
[c,h] = contour(X, Y, Z, v, 'b'); % the level sets at those heights

x0=0.1333; y0=-0.0666; % coordinates of the top of the hill
delta=0.01; % descend from the top of the hill with this step size
Angles=linspace(0, 2*pi, 20); % will draw 19 descent curves with Angles(i)

for i=1:length(Angles)
   x=x0+0.1*cos(Angles(i)); y=y0+0.1*sin(Angles(i)); % starting point
   Curve_x=[x]; Curve_y=[y]; % will hold a descent curve following the gradient

   % descend from the hill
   for j=1:500
      x=x-delta*fx(x);
      y=y-delta*fy(y);
      Curve_x=[Curve_x x]; Curve_y=[Curve_y y]; % append the updated values

      if max(abs(x), abs(y)) > 5 % stop when going beyond the picture frame
	 break;
      end
   end
   plot(Curve_x, Curve_y, 'r') % plot the curve of steepest descent
end

axis([Lx1 Lx2 Ly1 Ly2]); % the picture frame

saveas(gcf, 'level_grad.eps', 'psc2') % save as color postscript. Use gimp to convert
% to png. Does anybody know how to reduce aliasing (gimp helps, but only a bit)?
原始上传日志
Legend: (cur) = this is the current file, (del) = delete this old version, (rev) = revert to this old version.
Click on date to download the file or see the image uploaded on that date.


