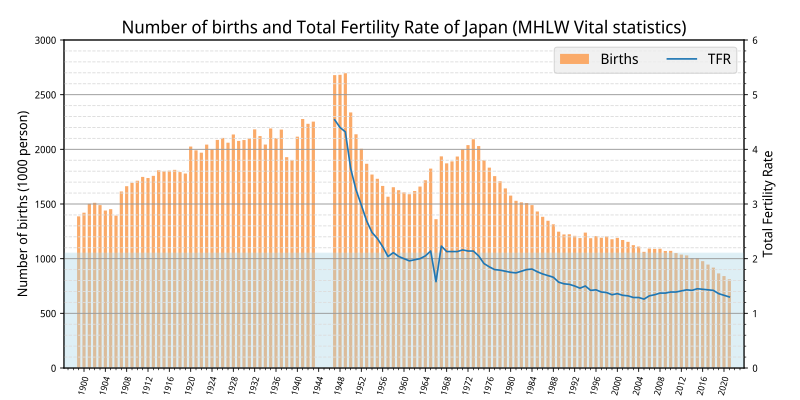
import matplotlib.pyplot as plt
from cycler import cycler
import pandas as pd
import numpy as np

df = pd.read_csv("data.tsv", index_col=0 , sep = "\t")

df1 = df.T.loc['TFR']		# line
df1 = df1.fillna(method='ffill')
df2 = df.T.loc['Births'].div(1000)	# bar

fig, ax = plt.subplots(figsize=(10, 5))
ax2 = ax.twinx()
plt.rcParams['font.family'] = 'sans-serif'
plt.rcParams['font.sans-serif'] = ['Noto Sans Display']

plt.subplots_adjust(left=0.08, bottom=0.08, right=0.93, top=0.90)

ax.bar(df2.index, df2, color="#FAAA69", width=0.6, label="Births")
ax.set_axisbelow(True)
ax.tick_params(axis='x', labelrotation=75)
ax.set_ylabel("Number of births (1000 person)", fontsize=12)
ax.set_ylim([0,3000])

ax2.set_ylabel("Total Fertility Rate", fontsize=12)
ax2.set_ylim([0,6])
ax2.axhspan(0,2.1, color="lightblue", alpha=0.4 , zorder=-10)
ax2.set_prop_cycle( plt.rcParams['axes.prop_cycle'] )
ax2.plot(df1, label="TFR")

ax.margins(0.02)
ax2.margins(0.02)

lines, labels = ax.get_legend_handles_labels()
lines2, labels2 = ax2.get_legend_handles_labels()
ax2.legend(lines + lines2, labels + labels2, facecolor="#eeeeee" ,
           ncol=2, fontsize=13,loc='upper right')

plt.title("Number of births and Total Fertility Rate of Japan (MHLW Vital statistics)", fontsize=16)

plt.setp(ax.get_xticklabels(), fontsize=8)
plt.setp(ax.get_yticklabels(), fontsize=9)
plt.xticks(np.arange(1900, 2021, step=4), fontsize=9)
plt.tick_params(labelsize=9, pad=4)

plt.minorticks_on()
plt.grid(which='major',color='#999999',linestyle='-', axis="y")
plt.grid(which='minor',color='#dddddd',linestyle='--', axis="y")

plt.savefig("image.svg")


